前言:训练一个网络,需要评价这个网络,并根据评价的结果想一下为什么是这样,怎样去优化这个网络,这样才是一个闭环。
如何评价训练好的网络
首先网络有一个参数是loss值,这反应了你训练好的网络得到的结果和真实值之间的差距。查看loss曲线随着迭代次数的增多,如何变化,有助于查看训练是否过拟合,是否学习率太小。
一. 生成loss变化曲线
1, 训练时保存log文件
nohup ./darknet detector train khadas_ai/khadas_ai.data khadas_ai/yolov3-khadas_ai.cfg_train darknet53.conv.74 -dont_show > train.log 2>&1 &
2, 使用extract_log.py脚本转化所需格式log
import inspect
import os
import random
import sys
def extract_log(log_file,new_log_file,key_word):
    with open(log_file, 'r') as f:
      with open(new_log_file, 'w') as train_log:
  #f = open(log_file)
    #train_log = open(new_log_file, 'w')
        for line in f:
          if 'Syncing' in line:
            continue
          if 'nan' in line:
            continue
          if 'Region 82 Avg' in line:
            continue
          if 'Region 94 Avg' in line:
            continue
          if 'Region 106 Avg' in line:
            continue
          if 'total_bbox' in line:
            continue
          if 'Loaded' in line:
            continue
          if key_word in line:
            train_log.write(line)
    f.close()
    train_log.close()

def extract_log2(log_file,new_log_file,key_word):
    with open(log_file, 'r') as f:
      with open(new_log_file, 'w') as train_log:
  #f = open(log_file)
    #train_log = open(new_log_file, 'w')
        for line in f:
          if 'Syncing' in line:
            continue
          if 'nan' in line:
            continue
          if 'Region 94 Avg' in line:
            continue
          if 'Region 106 Avg' in line:
            continue
          if 'total_bbox' in line:
            continue
          if 'Loaded' in line:
            continue
          if 'IOU: 0.000000' in line:
            continue
          if key_word in line:
            del_num=line.replace("v3 (mse loss, Normalizer: (iou: 0.75, obj: 1.00, cls: 1.00) Region 82 Avg (", "")
            train_log.write(del_num.replace(")", ""))
    f.close()
    train_log.close()
extract_log('train.log','train_log_loss.txt','images')
extract_log2('train.log','train_log_iou.txt','IOU')
运行extract_log.py脚本之后,会解析log文件的loss行和iou行得到两个txt文件。
3, 使用train_loss_visualization.py脚本可以绘制loss变化曲线
import pandas as pd
import numpy as np
import matplotlib.pyplot as plt
#%matplotlib inline

lines =18798    #Change to self generated Number of rows in train_log_loss.txt

#Adjusting the following two sets of numbers will help you view the details of the drawing
start_ite = 250 #Ignore Number of all lines starting in train_log_loss.txt
end_ite = 6000 #Ignore Number of all lines ending in train_log_loss.txt
result = pd.read_csv('train_log_loss.txt', skiprows=[x for x in range(lines) if ((x<start_ite) |(x>end_ite))] ,error_bad_lines=False, names=['loss', 'avg loss', 'rate', 'seconds', 'images'])
result.head()

result['loss']=result['loss'].str.split(' ').str.get(1)
result['avg']=result['avg loss'].str.split(' ').str.get(1)
result['rate']=result['rate'].str.split(' ').str.get(1)
result['seconds']=result['seconds'].str.split(' ').str.get(1)
result['images']=result['images'].str.split(' ').str.get(1)
result.head()
result.tail()

# print(result.head())
# print(result.tail())
# print(result.dtypes)
print(result['loss'])
#print(result['avg'])
#print(result['rate'])
#print(result['seconds'])
#print(result['images'])

result['loss']=pd.to_numeric(result['loss'])
result['avg']=pd.to_numeric(result['avg'])
result['rate']=pd.to_numeric(result['rate'])
result['seconds']=pd.to_numeric(result['seconds'])
result['images']=pd.to_numeric(result['images'])
result.dtypes


fig = plt.figure()
ax = fig.add_subplot(1, 1, 1)
ax.plot(result['loss'].values,label='avg_loss')
ax.legend(loc='best')
ax.set_title('The loss curves')
ax.set_xlabel('batches')
fig.savefig('avg_loss')
修改train_loss_visualization.py中lines为train_log_loss.txt行数,并根据需要修改要跳过的行数:
skiprows=[x for x in range(lines) if ((x<start_ite) |(x>end_ite))]
运行train_loss_visualization.py会在脚本所在路径生成avg_loss.png。
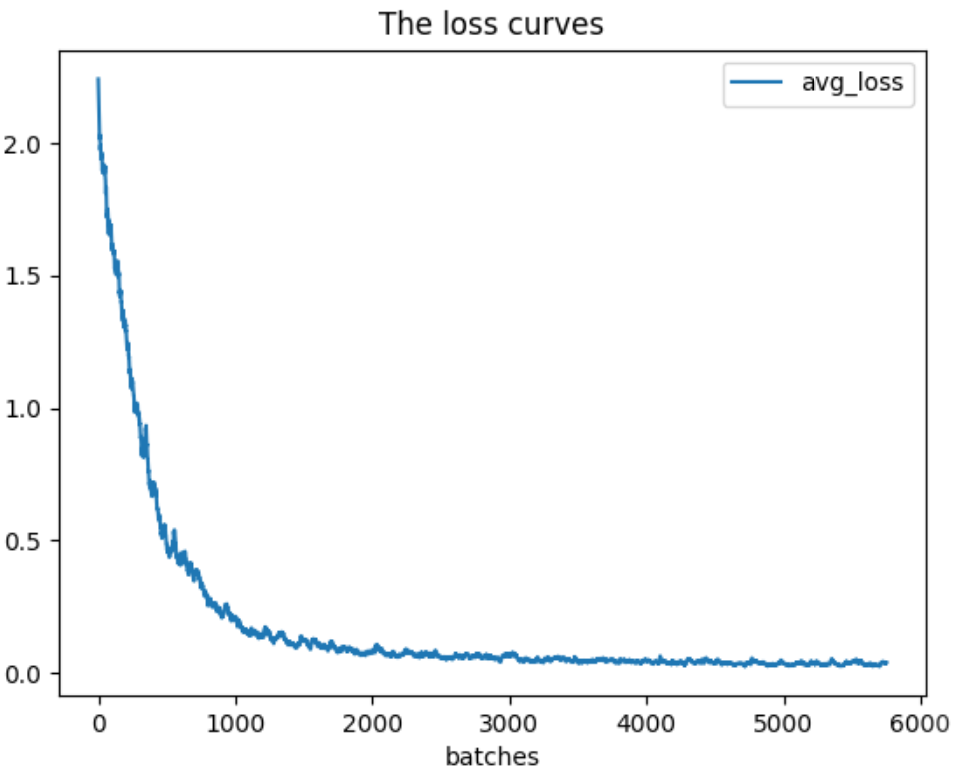
通过分析loss变化曲线,修改cfg中的学习率变化策略。除了可视化loss,还可以可视化Avg IOU等参数。可以使用脚本train_iou_visualization.py,使用方式和train_loss_visualization.py相同,train_iou_visualization.py脚本如下:
import pandas as pd
import numpy as np
import matplotlib.pyplot as plt
#%matplotlib inline

lines = 234429    #Change to self generated Number of rows in train_log_iou.txt

#Adjusting the following two sets of numbers will help you view the details of the drawing
start_ite = 1 #Ignore Number of all lines starting in train_log_iou.txt
end_ite = 234429 #Ignore Number of all lines ending in train_log_iou.txt
result = pd.read_csv('train_log_iou.txt', skiprows=[x for x in range(lines) if ((x<start_ite) |(x>end_ite)) ] ,error_bad_lines=False, names=['IOU', 'count', 'class_loss', 'iou_loss', 'total_loss'])
result.head()

result['IOU']=result['IOU'].str.split(': ').str.get(1)
result['count']=result['count'].str.split(': ').str.get(1)
result['class_loss']=result['class_loss'].str.split('= ').str.get(1)
result['iou_loss']=result['iou_loss'].str.split('= ').str.get(1)
result['total_loss']=result['total_loss'].str.split('= ').str.get(1)
result.head()
result.tail()

# print(result.head())
# print(result.tail())
# print(result.dtypes)
print(result['IOU'])
#print(result['count'])
#print(result['class_loss'])
#print(result['iou_loss'])
#print(result['total_loss'])

result['IOU']=pd.to_numeric(result['IOU'])
result['count']=pd.to_numeric(result['count'])
result['class_loss']=pd.to_numeric(result['class_loss'])
result['iou_loss']=pd.to_numeric(result['iou_loss'])
result['total_loss']=pd.to_numeric(result['total_loss'])
result.dtypes

fig = plt.figure()
ax = fig.add_subplot(1, 1, 1)
ax.plot(result['IOU'].values,label='IOU')
ax.legend(loc='best')
ax.set_title('The Region Avg IOU curves')
ax.set_xlabel('batches')
fig.savefig('Avg_IOU')
运行train_iou_visualization.py会在脚本所在路径生成Avg_IOU.png。
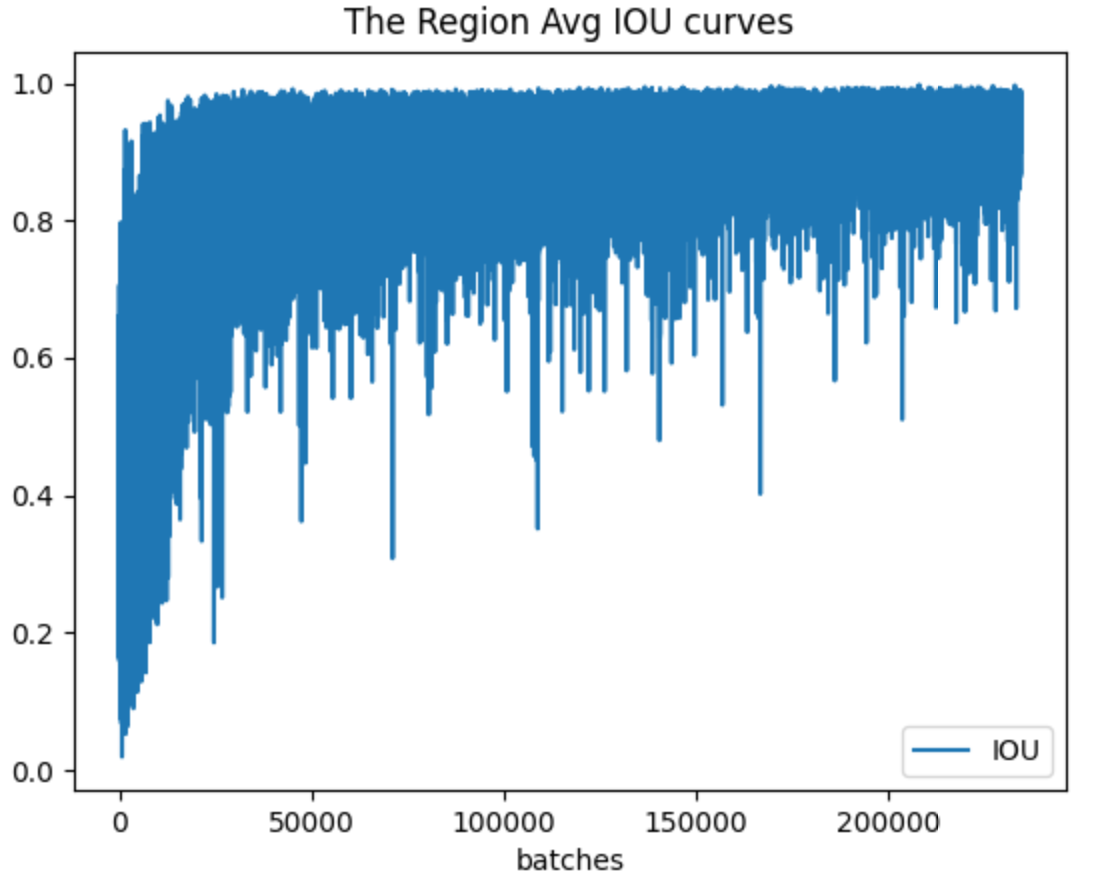
- Region Avg IOU: 这个是预测出的bbox和实际标注的bbox的交集除以他们的并集。显然,这个数值越大,说明预测的结果越好。
二. 查看训练网络的recall
recall就是被正确识别出来的正样本个数与测试集中所有正样本的个数的比值。显然,这个数值越大,说明预测的结果越好。
./darknet detector recall khadas_ai/khadas_ai.data khadas_ai/yolov3-khadas_ai.cfg_train khadas_ai/yolov3-khadas_ai_last.weights
最后得到的log如下:
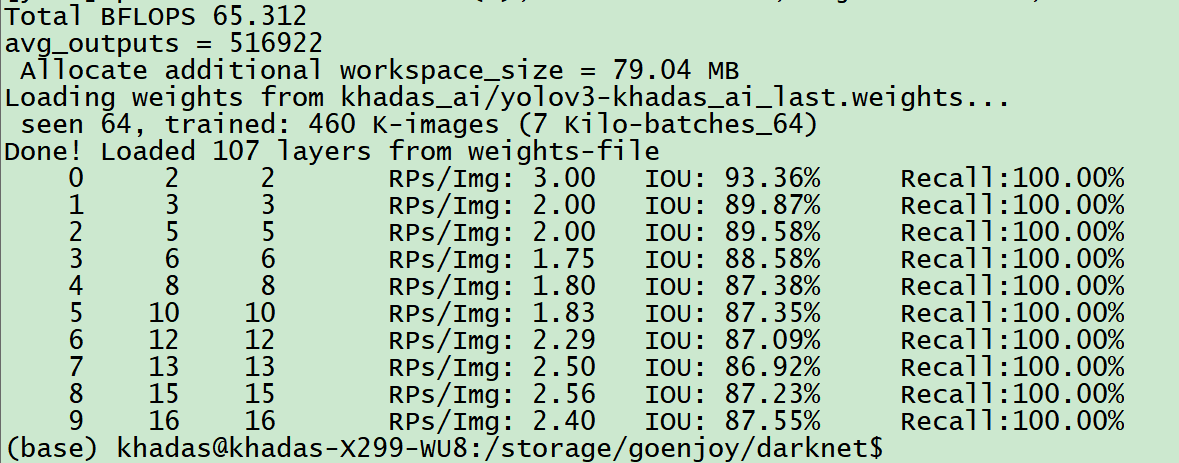
输出的格式为:
Number Correct Total Rps/Img IOU Recall
具体的解释如下:
- Number表示处理到第几张图片。
- Correct表示正确的识别除了多少bbox。这个值算出来的步骤是这样的,丢进网络一张图片,网络会预测出很多bbox,每个bbox都有其置信概率,概率大于threshold的bbox与实际的bbox,也就是labels中txt的内容计算IOU,找出IOU最大的bbox,如果这个最大值大于预设的IOU的threshold,那么correct加一。
- Total表示实际有多少个bbox。
- Rps/img表示平均每个图片会预测出来多少个bbox。
- IOU: 这个是预测出的bbox和实际标注的bbox的交集 除以 他们的并集。显然,这个数值越大,说明预测的结果越好。
- Recall召回率,意思是检测出物体的个数除以标注的所有物体个数。通过代码我们也能看出来就是Correct除以Total的值。