I just noticed that the vim2 pro’s BL2 initializes DDR4 memory at 1008Mhz.
could it be possible to clock it at 1200Mhz instead ? the S912 and samsung chips seem to support that frequency, so instead of a PCB limitation, I guess it should theoretically be possible.
comments from Khadas staff would be greatly appreciated
Hi, g4b42:
Yep, can be higher than 1008Mhz, but cannot reach 1200Mhz due to PCB limitation.
We have tested 1056Mhz and didn’t found any problems, but you can try to run higher freq on your board, just note that make each step as 24Mhz, e.x: 1008, 1032, 1056, 1080…
haven’t been able to try overclocking yet, but I’ve been doing tests with tinymembench, and results show that my vim2pro with default uboot has somehow worse memory latency (and for some cases, worse bandwidth) than an OrangePI One Plus with quad-core Allwinner H6 SoC and LPDDR3. I expected the DDR4 to have significant better latency…
how could we account for such a difference ?
vim2pro result:
tinymembench v0.4.9 (simple benchmark for memory throughput and latency)

==========================================================================
== Memory bandwidth tests                                               ==
==                                                                      ==
== Note 1: 1MB = 1000000 bytes                                          ==
== Note 2: Results for 'copy' tests show how many bytes can be          ==
==         copied per second (adding together read and writen           ==
==         bytes would have provided twice higher numbers)              ==
== Note 3: 2-pass copy means that we are using a small temporary buffer ==
==         to first fetch data into it, and only then write it to the   ==
==         destination (source -> L1 cache, L1 cache -> destination)    ==
== Note 4: If sample standard deviation exceeds 0.1%, it is shown in    ==
==         brackets                                                     ==
==========================================================================

 C copy backwards                                     :   1902.7 MB/s (2.0%)
 C copy backwards (32 byte blocks)                    :   1910.0 MB/s (1.8%)
 C copy backwards (64 byte blocks)                    :   1923.0 MB/s (1.9%)
 C copy                                               :   1926.9 MB/s (1.7%)
 C copy prefetched (32 bytes step)                    :   1376.7 MB/s
 C copy prefetched (64 bytes step)                    :   1534.5 MB/s
 C 2-pass copy                                        :   1498.1 MB/s
 C 2-pass copy prefetched (32 bytes step)             :    990.8 MB/s
 C 2-pass copy prefetched (64 bytes step)             :    922.1 MB/s (0.1%)
 C fill                                               :   5759.6 MB/s
 C fill (shuffle within 16 byte blocks)               :   5761.6 MB/s
 C fill (shuffle within 32 byte blocks)               :   5759.9 MB/s
 C fill (shuffle within 64 byte blocks)               :   5759.9 MB/s
 ---
 standard memcpy                                      :   1964.2 MB/s (0.3%)
 standard memset                                      :   5763.2 MB/s
 ---
 NEON LDP/STP copy                                    :   1941.6 MB/s (0.7%)
 NEON LDP/STP copy pldl2strm (32 bytes step)          :   1229.2 MB/s (0.8%)
 NEON LDP/STP copy pldl2strm (64 bytes step)          :   1598.4 MB/s (0.2%)
 NEON LDP/STP copy pldl1keep (32 bytes step)          :   2048.9 MB/s
 NEON LDP/STP copy pldl1keep (64 bytes step)          :   2047.2 MB/s
 NEON LD1/ST1 copy                                    :   1962.6 MB/s (0.7%)
 NEON STP fill                                        :   5763.2 MB/s
 NEON STNP fill                                       :   4639.6 MB/s (0.2%)
 ARM LDP/STP copy                                     :   1948.7 MB/s (0.7%)
 ARM STP fill                                         :   5763.1 MB/s
 ARM STNP fill                                        :   4637.8 MB/s (0.1%)

==========================================================================
== Memory latency test                                                  ==
==                                                                      ==
== Average time is measured for random memory accesses in the buffers   ==
== of different sizes. The larger is the buffer, the more significant   ==
== are relative contributions of TLB, L1/L2 cache misses and SDRAM      ==
== accesses. For extremely large buffer sizes we are expecting to see   ==
== page table walk with several requests to SDRAM for almost every      ==
== memory access (though 64MiB is not nearly large enough to experience ==
== this effect to its fullest).                                         ==
==                                                                      ==
== Note 1: All the numbers are representing extra time, which needs to  ==
==         be added to L1 cache latency. The cycle timings for L1 cache ==
==         latency can be usually found in the processor documentation. ==
== Note 2: Dual random read means that we are simultaneously performing ==
==         two independent memory accesses at a time. In the case if    ==
==         the memory subsystem can't handle multiple outstanding       ==
==         requests, dual random read has the same timings as two       ==
==         single reads performed one after another.                    ==
==========================================================================

block size : single random read / dual random read
      1024 :    0.0 ns          /     0.0 ns
      2048 :    0.0 ns          /     0.0 ns
      4096 :    0.0 ns          /     0.0 ns
      8192 :    0.0 ns          /     0.0 ns
     16384 :    0.0 ns          /     0.0 ns
     32768 :    0.0 ns          /     0.0 ns
     65536 :    4.1 ns          /     7.3 ns
    131072 :    6.3 ns          /    10.7 ns
    262144 :    7.6 ns          /    12.5 ns
    524288 :   91.0 ns          /   144.3 ns
   1048576 :  145.0 ns          /   195.2 ns
   2097152 :  173.5 ns          /   212.3 ns
   4194304 :  189.0 ns          /   220.1 ns
   8388608 :  196.2 ns          /   223.6 ns
  16777216 :  199.7 ns          /   225.7 ns
  33554432 :  201.5 ns          /   227.6 ns
  67108864 :  212.3 ns          /   247.6 ns
OrangePiH6 result:
tinymembench v0.4.9 (simple benchmark for memory throughput and latency)

==========================================================================
== Memory bandwidth tests                                               ==
==                                                                      ==
== Note 1: 1MB = 1000000 bytes                                          ==
== Note 2: Results for 'copy' tests show how many bytes can be          ==
==         copied per second (adding together read and writen           ==
==         bytes would have provided twice higher numbers)              ==
== Note 3: 2-pass copy means that we are using a small temporary buffer ==
==         to first fetch data into it, and only then write it to the   ==
==         destination (source -> L1 cache, L1 cache -> destination)    ==
== Note 4: If sample standard deviation exceeds 0.1%, it is shown in    ==
==         brackets                                                     ==
==========================================================================

 C copy backwards                                     :   1877.5 MB/s (1.9%)
 C copy backwards (32 byte blocks)                    :   1854.7 MB/s (2.7%)
 C copy backwards (64 byte blocks)                    :   1896.7 MB/s (3.4%)
 C copy                                               :   1925.6 MB/s (2.6%)
 C copy prefetched (32 bytes step)                    :   1330.1 MB/s
 C copy prefetched (64 bytes step)                    :   1207.6 MB/s
 C 2-pass copy                                        :   1575.2 MB/s (0.2%)
 C 2-pass copy prefetched (32 bytes step)             :   1160.9 MB/s (0.2%)
 C 2-pass copy prefetched (64 bytes step)             :   1016.1 MB/s
 C fill                                               :   6320.6 MB/s (0.2%)
 C fill (shuffle within 16 byte blocks)               :   6328.0 MB/s (0.2%)
 C fill (shuffle within 32 byte blocks)               :   6302.3 MB/s
 C fill (shuffle within 64 byte blocks)               :   6337.2 MB/s (0.3%)
 ---
 standard memcpy                                      :   1930.6 MB/s (0.4%)
 standard memset                                      :   6327.3 MB/s (0.1%)
 ---
 NEON LDP/STP copy                                    :   1912.6 MB/s (0.4%)
 NEON LDP/STP copy pldl2strm (32 bytes step)          :   1188.5 MB/s (0.9%)
 NEON LDP/STP copy pldl2strm (64 bytes step)          :   1500.2 MB/s (0.4%)
 NEON LDP/STP copy pldl1keep (32 bytes step)          :   2080.4 MB/s
 NEON LDP/STP copy pldl1keep (64 bytes step)          :   2080.2 MB/s (0.3%)
 NEON LD1/ST1 copy                                    :   1918.6 MB/s (0.8%)
 NEON STP fill                                        :   6338.4 MB/s (0.2%)
 NEON STNP fill                                       :   4396.2 MB/s (3.5%)
 ARM LDP/STP copy                                     :   1915.9 MB/s (0.5%)
 ARM STP fill                                         :   6346.2 MB/s (0.3%)
 ARM STNP fill                                        :   4310.1 MB/s (2.5%)

==========================================================================
== Memory latency test                                                  ==
==                                                                      ==
== Average time is measured for random memory accesses in the buffers   ==
== of different sizes. The larger is the buffer, the more significant   ==
== are relative contributions of TLB, L1/L2 cache misses and SDRAM      ==
== accesses. For extremely large buffer sizes we are expecting to see   ==
== page table walk with several requests to SDRAM for almost every      ==
== memory access (though 64MiB is not nearly large enough to experience ==
== this effect to its fullest).                                         ==
==                                                                      ==
== Note 1: All the numbers are representing extra time, which needs to  ==
==         be added to L1 cache latency. The cycle timings for L1 cache ==
==         latency can be usually found in the processor documentation. ==
== Note 2: Dual random read means that we are simultaneously performing ==
==         two independent memory accesses at a time. In the case if    ==
==         the memory subsystem can't handle multiple outstanding       ==
==         requests, dual random read has the same timings as two       ==
==         single reads performed one after another.                    ==
==========================================================================

block size : single random read / dual random read
      1024 :    0.0 ns          /     0.0 ns
      2048 :    0.0 ns          /     0.0 ns
      4096 :    0.0 ns          /     0.0 ns
      8192 :    0.0 ns          /     0.0 ns
     16384 :    0.0 ns          /     0.0 ns
     32768 :    0.0 ns          /     0.0 ns
     65536 :    3.8 ns          /     6.4 ns
    131072 :    5.8 ns          /     8.9 ns
    262144 :    6.9 ns          /     9.9 ns
    524288 :    7.6 ns          /    10.5 ns
   1048576 :   71.9 ns          /   111.1 ns
   2097152 :  106.4 ns          /   143.8 ns
   4194304 :  128.6 ns          /   159.9 ns
   8388608 :  140.2 ns          /   167.4 ns
  16777216 :  146.4 ns          /   172.0 ns
  33554432 :  150.2 ns          /   174.9 ns
  67108864 :  153.7 ns          /   177.6 ns
NOTE: test results have been edited after running a new test with following gcc options:
also for comparison, here’s the result for an odroid C2 (amlogic S905, 2GB DDR3) as found here.
we see that it also has somehow better results than the vim2pro:
tinymembench v0.4.9 (simple benchmark for memory throughput and latency)

==========================================================================
== Memory bandwidth tests                                               ==
==                                                                      ==
== Note 1: 1MB = 1000000 bytes                                          ==
== Note 2: Results for 'copy' tests show how many bytes can be          ==
==         copied per second (adding together read and writen           ==
==         bytes would have provided twice higher numbers)              ==
== Note 3: 2-pass copy means that we are using a small temporary buffer ==
==         to first fetch data into it, and only then write it to the   ==
==         destination (source -> L1 cache, L1 cache -> destination)    ==
== Note 4: If sample standard deviation exceeds 0.1%, it is shown in    ==
==         brackets                                                     ==
==========================================================================

 C copy backwards                                     :   1677.6 MB/s (0.4%)
 C copy backwards (32 byte blocks)                    :   1678.6 MB/s (1.2%)
 C copy backwards (64 byte blocks)                    :   1663.4 MB/s (1.1%)
 C copy                                               :   1752.2 MB/s (0.5%)
 C copy prefetched (32 bytes step)                    :   1237.9 MB/s
 C copy prefetched (64 bytes step)                    :   1420.2 MB/s
 C 2-pass copy                                        :   1514.5 MB/s
 C 2-pass copy prefetched (32 bytes step)             :   1098.7 MB/s
 C 2-pass copy prefetched (64 bytes step)             :    933.2 MB/s
 C fill                                               :   3731.0 MB/s
 C fill (shuffle within 16 byte blocks)               :   3730.9 MB/s
 C fill (shuffle within 32 byte blocks)               :   3730.3 MB/s
 C fill (shuffle within 64 byte blocks)               :   3731.0 MB/s
 ---
 standard memcpy                                      :   1761.4 MB/s (0.3%)
 standard memset                                      :   3732.1 MB/s
 ---
 NEON LDP/STP copy                                    :   1742.8 MB/s
 NEON LD1/ST1 copy                                    :   1755.1 MB/s (0.2%)
 NEON STP fill                                        :   3731.1 MB/s
 NEON STNP fill                                       :   2644.9 MB/s (0.2%)
 ARM LDP/STP copy                                     :   1754.3 MB/s (0.4%)
 ARM STP fill                                         :   3732.2 MB/s
 ARM STNP fill                                        :   2638.0 MB/s

==========================================================================
== Framebuffer read tests.                                              ==
==                                                                      ==
== Many ARM devices use a part of the system memory as the framebuffer, ==
== typically mapped as uncached but with write-combining enabled.       ==
== Writes to such framebuffers are quite fast, but reads are much       ==
== slower and very sensitive to the alignment and the selection of      ==
== CPU instructions which are used for accessing memory.                ==
==                                                                      ==
== Many x86 systems allocate the framebuffer in the GPU memory,         ==
== accessible for the CPU via a relatively slow PCI-E bus. Moreover,    ==
== PCI-E is asymmetric and handles reads a lot worse than writes.       ==
==                                                                      ==
== If uncached framebuffer reads are reasonably fast (at least 100 MB/s ==
== or preferably >300 MB/s), then using the shadow framebuffer layer    ==
== is not necessary in Xorg DDX drivers, resulting in a nice overall    ==
== performance improvement. For example, the xf86-video-fbturbo DDX     ==
== uses this trick.                                                     ==
==========================================================================

 NEON LDP/STP copy (from framebuffer)                 :    212.6 MB/s
 NEON LDP/STP 2-pass copy (from framebuffer)          :    206.4 MB/s
 NEON LD1/ST1 copy (from framebuffer)                 :     58.0 MB/s
 NEON LD1/ST1 2-pass copy (from framebuffer)          :     57.4 MB/s
 ARM LDP/STP copy (from framebuffer)                  :    111.5 MB/s
 ARM LDP/STP 2-pass copy (from framebuffer)           :    109.7 MB/s

==========================================================================
== Memory latency test                                                  ==
==                                                                      ==
== Average time is measured for random memory accesses in the buffers   ==
== of different sizes. The larger is the buffer, the more significant   ==
== are relative contributions of TLB, L1/L2 cache misses and SDRAM      ==
== accesses. For extremely large buffer sizes we are expecting to see   ==
== page table walk with several requests to SDRAM for almost every      ==
== memory access (though 64MiB is not nearly large enough to experience ==
== this effect to its fullest).                                         ==
==                                                                      ==
== Note 1: All the numbers are representing extra time, which needs to  ==
==         be added to L1 cache latency. The cycle timings for L1 cache ==
==         latency can be usually found in the processor documentation. ==
== Note 2: Dual random read means that we are simultaneously performing ==
==         two independent memory accesses at a time. In the case if    ==
==         the memory subsystem can't handle multiple outstanding       ==
==         requests, dual random read has the same timings as two       ==
==         single reads performed one after another.                    ==
==========================================================================

block size : single random read / dual random read
      1024 :    0.0 ns          /     0.0 ns
      2048 :    0.0 ns          /     0.0 ns
      4096 :    0.0 ns          /     0.0 ns
      8192 :    0.0 ns          /     0.0 ns
     16384 :    0.0 ns          /     0.0 ns
     32768 :    0.0 ns          /     0.0 ns
     65536 :    4.4 ns          /     7.5 ns
    131072 :    6.8 ns          /    10.4 ns
    262144 :    8.0 ns          /    11.5 ns
    524288 :   12.0 ns          /    17.6 ns
   1048576 :   77.0 ns          /   116.2 ns
   2097152 :  107.6 ns          /   146.2 ns
   4194304 :  128.9 ns          /   164.0 ns
   8388608 :  140.2 ns          /   172.4 ns
  16777216 :  147.0 ns          /   178.0 ns
  33554432 :  151.2 ns          /   181.7 ns
  67108864 :  153.6 ns          /   184.0 ns
Im interested in this one as well - if there is something that could be done to increase the memory bandwidth it would really help with my mining application!
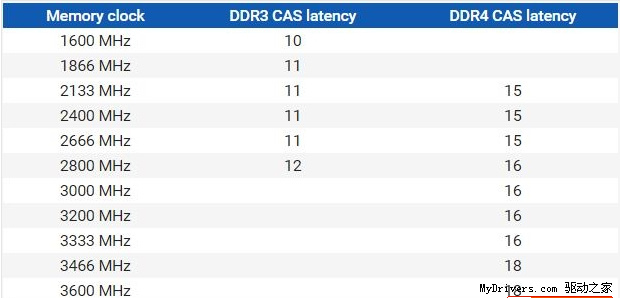
I assume the number 18 after ‘2T’ designates CAS latency as configured by the DDR registers in u-boot/board/khadas/kvim2/firmware/timing.c (which are obscure to anyone without access to amlogic’s full SoC documentation)
however, according to the chart you provided above, CL=18 should be matched with frequencies that the kvim2’s DDR4 doesn’t even get close to… even with the clock at the unreachable 1200Mhz, CL should be 15 instead of 18.
that would explain the higher true latencies observed on kvim2.
in fact even without amlogic privileged info, the CL config is quite clear in the uboot source, in the ddr4 2400 timing block of the __ddr_timming (sic) structure:
.cfg_ddr_cl = 15*1.2,// (11),
we see here that CL=15 * 1.2 = 18. that ddr 2400 config block’s values appear to be copy-pasted-then modified from the ddr4 1600 config just above it (and apparently this was done by amlogic themselves, because the same lines are present in reference board configs such as gxm_q201_v1)
maybe support/comments from amlogic on this issue would be helpful…
in the meantime, I’ve been fumbling with various defines and options in u-boot, and it happens something a bit magic happens when I set the CONFIG_DDR4_TIMING_TEST option to 1 here
the CL value advertised by BL2 gets to 15 instead of 18, and I get slightly better latency in my application… (more benching values to come later with tinymembench)
tinymembench v0.4.9 (simple benchmark for memory throughput and latency)

==========================================================================
== Memory bandwidth tests                                               ==
==                                                                      ==
== Note 1: 1MB = 1000000 bytes                                          ==
== Note 2: Results for 'copy' tests show how many bytes can be          ==
==         copied per second (adding together read and writen           ==
==         bytes would have provided twice higher numbers)              ==
== Note 3: 2-pass copy means that we are using a small temporary buffer ==
==         to first fetch data into it, and only then write it to the   ==
==         destination (source -> L1 cache, L1 cache -> destination)    ==
== Note 4: If sample standard deviation exceeds 0.1%, it is shown in    ==
==         brackets                                                     ==
==========================================================================

 C copy backwards                                     :   2002.0 MB/s (3.4%)
 C copy backwards (32 byte blocks)                    :   2023.7 MB/s (1.9%)
 C copy backwards (64 byte blocks)                    :   2061.2 MB/s (3.7%)
 C copy                                               :   2019.1 MB/s (2.3%)
 C copy prefetched (32 bytes step)                    :   1483.4 MB/s
 C copy prefetched (64 bytes step)                    :   1675.7 MB/s
 C 2-pass copy                                        :   1590.7 MB/s
 C 2-pass copy prefetched (32 bytes step)             :   1048.7 MB/s
 C 2-pass copy prefetched (64 bytes step)             :    952.8 MB/s (0.2%)
 C fill                                               :   5860.4 MB/s
 C fill (shuffle within 16 byte blocks)               :   5860.9 MB/s
 C fill (shuffle within 32 byte blocks)               :   5859.4 MB/s
 C fill (shuffle within 64 byte blocks)               :   5860.2 MB/s
 ---
 standard memcpy                                      :   2095.3 MB/s (0.1%)
 standard memset                                      :   5862.6 MB/s
 ---
 NEON LDP/STP copy                                    :   2056.0 MB/s (1.2%)
 NEON LDP/STP copy pldl2strm (32 bytes step)          :   1320.1 MB/s (0.9%)
 NEON LDP/STP copy pldl2strm (64 bytes step)          :   1728.4 MB/s (0.3%)
 NEON LDP/STP copy pldl1keep (32 bytes step)          :   2216.4 MB/s
 NEON LDP/STP copy pldl1keep (64 bytes step)          :   2216.3 MB/s
 NEON LD1/ST1 copy                                    :   2113.0 MB/s (1.0%)
 NEON STP fill                                        :   5862.4 MB/s
 NEON STNP fill                                       :   4752.6 MB/s (0.1%)
 ARM LDP/STP copy                                     :   2078.7 MB/s (1.3%)
 ARM STP fill                                         :   5861.7 MB/s
 ARM STNP fill                                        :   4748.7 MB/s

==========================================================================
== Memory latency test                                                  ==
==                                                                      ==
== Average time is measured for random memory accesses in the buffers   ==
== of different sizes. The larger is the buffer, the more significant   ==
== are relative contributions of TLB, L1/L2 cache misses and SDRAM      ==
== accesses. For extremely large buffer sizes we are expecting to see   ==
== page table walk with several requests to SDRAM for almost every      ==
== memory access (though 64MiB is not nearly large enough to experience ==
== this effect to its fullest).                                         ==
==                                                                      ==
== Note 1: All the numbers are representing extra time, which needs to  ==
==         be added to L1 cache latency. The cycle timings for L1 cache ==
==         latency can be usually found in the processor documentation. ==
== Note 2: Dual random read means that we are simultaneously performing ==
==         two independent memory accesses at a time. In the case if    ==
==         the memory subsystem can't handle multiple outstanding       ==
==         requests, dual random read has the same timings as two       ==
==         single reads performed one after another.                    ==
==========================================================================

block size : single random read / dual random read
      1024 :    0.0 ns          /     0.0 ns
      2048 :    0.0 ns          /     0.0 ns
      4096 :    0.0 ns          /     0.0 ns
      8192 :    0.0 ns          /     0.0 ns
     16384 :    0.0 ns          /     0.0 ns
     32768 :    0.0 ns          /     0.0 ns
     65536 :    4.1 ns          /     7.5 ns
    131072 :    6.3 ns          /    10.7 ns
    262144 :    7.6 ns          /    12.5 ns
    524288 :   84.2 ns          /   132.5 ns
   1048576 :  133.1 ns          /   178.0 ns
   2097152 :  158.8 ns          /   193.3 ns
   4194304 :  173.1 ns          /   201.6 ns
   8388608 :  179.8 ns          /   205.8 ns
  16777216 :  183.3 ns          /   208.7 ns
  33554432 :  185.1 ns          /   210.8 ns
  67108864 :  197.7 ns          /   236.2 ns
and indeed it looks a little better than previously with default settings.