Underwhelming performance Khadas Vim2 Max in video rendering kdenlive

Thank you dukla2000.
I’ve just tried a first benchmark with nothing changed. The result was 1h43m14s. So not far of the original ones.
I’ll now try with performance governor on. This was on-demand.

I also tried to create a swap file but was unsuccesful. This is what I did.
khadas@Khadas:~$ sudo fallocate -l 1g /swapfile
khadas@Khadas:~$ ls -lh /swapfile
-rw-r–r-- 1 root root 1.0G Apr 24 19:15 /swapfile
khadas@Khadas:~$ sudo chmod 600 /swapfile
khadas@Khadas:~$ ls -lh /swapfile
-rw------- 1 root root 1.0G Apr 24 19:15 /swapfile
khadas@Khadas:~$ sudo mkswap /swapfile
Setting up swapspace version 1, size = 1024 MiB (1073737728 bytes)
no label, UUID=30fd36df-e71c-45e7-8a04-bde604fb56f6
khadas@Khadas:~$ sudo swapon --show
khadas@Khadas:~$ free -h
total used free shared buff/cache available
Mem: 2.9G 378M 2.0G 21M 608M 2.4G
Swap: 0B 0B 0B
khadas@Khadas:~$

Swap file was created, but not activated. Any idea?

Also here’s a screenshot on a point it starts going slow. You see that the ram suddenly bumps, and then it slows down. After a while it goes good again, and at the end it’s for 30minutes like that.

The S912 is no big.LITTLE design so there are no fast cores. It’s just 8 slow A53 and 4 of them allowed to clock up to 1.4 GHz while the other 4 are artificially slowed down to 1.0 GHz.

Since this is known the scheduler has to take care of this and move all demanding tasks to those cores that are allowed to clock slightly faster (as it’s done on real big.LITTLE designs everywhere). If the scheduler is broken by design and the user has to use taskset limiting processes to the 4 slightly faster clocked cores… what’s the purpose of an octa-core SoC then?

I wouldn’t worry about a swap file: in the event you run out of RAM you may as well crash rather than start swapping because swapping is horrendously slow. (Or more constructively: if/when you start crashing because of RAM shortage then worry about getting a swap sorted.)

I have to agree I find mixes of cores confusing - the only circumstance that makes sense to me is power/battery saving to use a very slow, but very energy efficient core for basic housekeeping-like stuff and only wake the fast (more energy sapping) cores when essential. And so in a usage case like my VIM2 plugged into 240V it is hard to see the point. Pretty sure elsewhere I have seen throughput better on an S905 than S912 as the scheduler inappropriately assigned work to the slower cores.

I use them for video rendering with battery`s charged with a solar panel when on trips. So power efficiency was very important when I bought it. But my most expencive sbc is also one of the most useless for me since it performs this bad with kdenlive.

Ive bought a lot new sbcs always hoping it would be better than my C2(and because I like them so much). But not one compares with it in power efficiency, not overheating while maxed out and being fast.
I bought the rock64 thinking it was 1.5Ghz, the Orange Pi +2 thinking it was 1.6Ghz(still advertised as up to 1.6Ghz). At least Hardkernel did something when they found out the C2 wasnt 2Ghz and they stopped advertising it was. The Tinker is still a nightmare in everything, and I dont see that changing.

So I would like it that the Khadas at least would perform better for me. Other than Kdenlive it is an ok board.
On paper it looked amazing…

The swap isnt because I run out of memory. I do think there could be a problem here with memory usuage. I just dont know if I cant test it. So any ideas why it wont work?

(Or more constructively: if/when you start crashing because of RAM shortage then worry about getting a swap sorted.)

Right, swap obviously has its reason of existence for so many years now to get the job done on systems with limited amount of memory. If my firefox native gentoo build would crash, I would never have a gentoo native build firefox. Just an example.

Well, on real big.LITTLE designs there is one cluster of fast CPU cores (A15, A17, A72, A73, …) combined with one cluster of slow but energy efficient cores (A7, A53). On the S912 there’s just 8 slow cores made in the same process (no idea whether it’s 28nm or 40nm – I don’t trust in a single word told by Amlogic any more). So there is simply no reason to limit one cluster to 1 GHz and allow the other to operate at 1.4 GHz.

Other SoC designs with similar little.LITTLE implementation (Allwinner A83T with 8xA7 or Samsung/Nexell S5P6818 with 8xA53) of course allow to clock all CPU cores identically. On those designs there’s also no scheduler problem like with S912 now where the scheduler puts demanding tasks on the slower slow cores instead of the 1.4 GHz cluster.

Since someone said the cluster would show different consumption behaviour… why? It’s the same cores just with different artificial clockspeed limits. By locking the ‘fast’ cluster to 1 GHz and using taskset with any demanding load it should be easy to check for this. But I really doubt that there are consumption differences.

And if consumption would be an issue then the user should be able to control cpufreq behaviour on his own. But not even this is possible as we’ve seen since without fixed CPU affinitiy the bl30.bin BLOB uses whatever cpufreq OPPs below 1000 MHz anyway.

And then due to 4 cores being limited to just 1.0 GHz and 4 to 1.4 GHz the Vim2 should not be advertised as ‘1.5 GHz 64Bit Octa Core ARM Cortex-A53’ since in octa-core mode it’s just 1.2 GHz on average. And the available performance data doesn’t look good for the Vim2 anyway. Now that you discovered this scheduler weirdness with the 4.9 kernel with demanding tasks sent to the slowest cores at least it gets understandable.

Still interested in the results of the following two benchmarks testing for combined CPU+memory performance and only memory:

taskset -c 0-3 7zr b -mmt4
taskset -c 4-7 7zr b -mmt4
taskset -c 3 tinymembench
taskset -c 7 tinymembench

Requires an apt install p7zip and for tinymembench a quick compilation. @g4b42 already provided tinymembench numbers but as we learned recently the scheduler at least with 4.9 kernel behaves weird and demanding tasks end up on the slowest CPU cores. And at least with real big.LITTLE designs running on the two clusters results in a huge memory performance difference!

1 Like

Without specifying which OS, which version of the program is used, and other details, all conversations are a waste of time. If kdeline works well on armhf and poorly on aarch64, it means that this program does not use all the features of the new architecture. In A32 emulation mode on A64 (via hypervisor), this will always be worse than in native mode.

Are you serious?

  • ODROID-C2 (4 x A53 @ 1.75 MHz): 1h43m01s
  • Vim2: (8 x A53 @ 1.2 GHz): 1h43m14s

If the program uses all cores then Vim2 should be at least 35% faster than C2.

Where’s the point talking about armhf vs. aarch64? Also @NicoD clearly shows and clearly describes that something’s wrong at the end of the task (look at the screenshot).

@NicoD: Do an ‘apt install sysstat’ in case you’re not running Armbian and then let this run in another shell:

sudo iostat 60

This will report every minute what the system is doing in detail. Most probably once everything gets slow you’ll see an increase in %iowait percentage?

And you might provide the output of

apt-cache show kdenlive

on C2 and Vim2

1 Like

@tkaiser Here’s the result of 7zip.
khadas@Khadas:~$ taskset -c 0-3 7zr b -mmt4

7-Zip (A) 9.20 Copyright © 1999-2010 Igor Pavlov 2010-11-18
p7zip Version 9.20 (locale=en_US.UTF-8,Utf16=on,HugeFiles=on,8 CPUs)

RAM size: 2998 MB, # CPU hardware threads: 8
RAM usage: 850 MB, # Benchmark threads: 4

Dict Compressing | Decompressing
Speed Usage R/U Rating | Speed Usage R/U Rating
KB/s % MIPS MIPS | KB/s % MIPS MIPS

22: 1550 336 449 1507 | 49452 394 1132 4461
23: 1629 343 484 1660 | 46935 396 1085 4295
24: 1474 364 435 1585 | 44544 392 1054 4132
25: 1477 369 457 1686 | 43813 393 1048 4120

Avr: 353 456 1610 394 1080 4252
Tot: 373 768 2931

khadas@Khadas:~$ taskset -c 4-7 7zr b -mmt4

7-Zip (A) 9.20 Copyright © 1999-2010 Igor Pavlov 2010-11-18
p7zip Version 9.20 (locale=en_US.UTF-8,Utf16=on,HugeFiles=on,8 CPUs)

RAM size: 2998 MB, # CPU hardware threads: 8
RAM usage: 850 MB, # Benchmark threads: 4

Dict Compressing | Decompressing
Speed Usage R/U Rating | Speed Usage R/U Rating
KB/s % MIPS MIPS | KB/s % MIPS MIPS

22: 1244 317 381 1210 | 35689 395 815 3220
23: 1248 320 397 1272 | 34702 394 805 3175
24: 1217 337 388 1309 | 33657 394 791 3122
25: 1201 347 394 1371 | 32942 395 784 3097

Avr: 330 390 1290 395 799 3154
Tot: 362 595 2222

I downloaded tinymembench from github, but am unable to use it correctly. I don’t know how to use/install it. Here’s what I done.
khadas@Khadas:~$ cd tinymembench-master
khadas@Khadas:~/tinymembench-master$ sudo make
cc -O2 -c util.c
cc -O2 -c asm-opt.c
cc -O2 -c x86-sse2.S
cc -O2 -c arm-neon.S
cc -O2 -c mips-32.S
cc -O2 -c aarch64-asm.S
cc -O2 -o tinymembench main.c util.o asm-opt.o x86-sse2.o arm-neon.o mips-32.o aarch64-asm.o -lm
khadas@Khadas:~/tinymembench-master$ taskset -c 3 tinymembench
taskset: failed to execute tinymembench: No such file or directory
khadas@Khadas:~/tinymembench-master$ CC=arm-linux-gnueabinf-gcc CFLAGS="-02 -mcpu=A53" make
make: Nothing to be done for ‘all’.
khadas@Khadas:~/tinymembench-master$ CC=arm-linux-gnueabinf-gcc CFLAGS="-02 -mcpu=a53" make
make: Nothing to be done for ‘all’.

I’ll now do the sysstat and apt-cache show kdenlive.
Great advice all. I’m glad somebody takes it serious.

“Without specifying which OS, which version of the program is used, and other details, all conversations are a waste of time.”
@balbes150 I use Ubuntu 16.04.4 LTS with the Mate desktop 1.12.1
Kdenlive is version 15.12.3

If you ask me, then I’ll tell you. Nobody forces you to give your opinion here. I just would like to find a solution, I’m no expert in anything. Certaily no Linux expert. Only with the help of people who know better I can learn.
So double thanks to @tkaiser who finally comes with some sensable information. I don’t mind testing the sh*t out of these things. But if I don’t know what to test…

Any idea why swap isn’t working? I know it’s a long shot, but I do want to try it.
Greetings, NicoD

Thank you. More or less the same numbers @numbqq already provided over there: Underwhelming performance Khadas Vim2 Max in video rendering kdenlive - #15 by numbqq

In other words: Vim2 running a pretty capable benchmark testing both CPU performance and memory bandwidth limited to running with only 4 cores performs slower than a Raspberry Pi 3 at 1200 MHz (even on the faster slow cluster condemned to run at 1416 MHz).

There’s something seriously wrong.

Indeed. Also the small cores perform at 71% of the big cores. Where this should be 66% if it were 1Ghz and 1.5Ghz.
But 1Ghz is 71% of 1.4Ghz. So if I counted well, then you’re completely right about the 1.4Ghz.

@tkaiser Here the result of apt-cache show kdenlive on the Khadas
I just locked mysel out of my C2 because I did an upgrade with a low battery(not smart at all), Ill reinstsll, but itll take some time.

khadas@Khadas:~$ sudo apt-cache show kdenlive
Package: kdenlive
Priority: optional
Section: universe/graphics
Installed-Size: 4590
Maintainer: Ubuntu Developers ubuntu-devel-discuss@lists.ubuntu.com
Original-Maintainer: Patrick Matthäi pmatthaei@debian.org
Architecture: arm64
Version: 4:15.12.3-0ubuntu1
Depends: ffmpeg, kded5, kdenlive-data (= 4:15.12.3-0ubuntu1), kinit, kio, melt, oxygen-icon-theme, qml-module-qtquick2, libc6 (>= 2.17), libkf5archive5 (>= 4.96.0), libkf5bookmarks5 (>= 4.96.0), libkf5completion5 (>= 4.97.0), libkf5configcore5 (>= 4.98.0), libkf5configgui5 (>= 4.97.0), libkf5configwidgets5 (>= 4.96.0), libkf5coreaddons5 (>= 4.100.0), libkf5dbusaddons5 (>= 4.97.0), libkf5guiaddons5 (>= 4.96.0), libkf5i18n5 (>= 4.97.0), libkf5iconthemes5 (>= 4.96.0), libkf5itemviews5 (>= 4.96.0), libkf5jobwidgets5 (>= 4.96.0), libkf5kiocore5 (>= 4.96.0), libkf5kiofilewidgets5 (>= 4.96.0), libkf5kiowidgets5 (>= 4.99.0), libkf5newstuff5 (>= 4.95.0), libkf5notifications5 (>= 4.96.0), libkf5notifyconfig5 (>= 4.96.0), libkf5plotting5 (>= 4.96.0), libkf5service-bin, libkf5service5 (>= 4.96.0), libkf5solid5 (>= 4.97.0), libkf5textwidgets5 (>= 5.0.0), libkf5widgetsaddons5 (>= 4.96.0), libkf5xmlgui5 (>= 4.98.0), libmlt++3 (>= 6.0.0), libmlt6 (>= 6.0.0), libqt5core5a (>= 5.5.0), libqt5dbus5 (>= 5.0.2), libqt5gui5 (>= 5.3.0) | libqt5gui5-gles (>= 5.3.0), libqt5network5 (>= 5.0.2), libqt5quick5 (>= 5.0.2) | libqt5quick5-gles (>= 5.0.2), libqt5script5 (>= 5.0.2), libqt5svg5 (>= 5.0.2), libqt5widgets5 (>= 5.2.0), libqt5xml5 (>= 5.0.2), libstdc++6 (>= 4.1.1)
Recommends: dvdauthor, dvgrab, frei0r-plugins, genisoimage, recordmydesktop, swh-plugins
Suggests: khelpcenter
Filename: pool/universe/k/kdenlive/kdenlive_15.12.3-0ubuntu1_arm64.deb
Size: 1203040
MD5sum: 7761533f9063b1b4a60e7d9e8ca624ce
SHA1: 75ad18574a9f54543d50790e59145a16b4485f36
SHA256: 4ad7e0d503ef54b698884e43b9adaa2bb6917effb6f271849cf72ac23473cb17
Description-en: non-linear video editor
Kdenlive is a non-linear video editing suite, which supports DV, HDV and many
more formats.
Its main features are:

  • Guides and marker for organizing timelines
  • Copy and paste support for clips, effects and transitions
  • Real time changes
  • FireWire and Video4Linux capture
  • Screen grabbing
  • Exporting to any by FFMPEG supported format
    Description-md5: 4e8f8c02918f6de02fc8e354d08ec99c
    Homepage: http://www.kdenlive.org/
    Bugs: https://bugs.launchpad.net/ubuntu/+filebug
    Origin: Ubuntu
    Supported: 9m
    Task: ubuntustudio-video
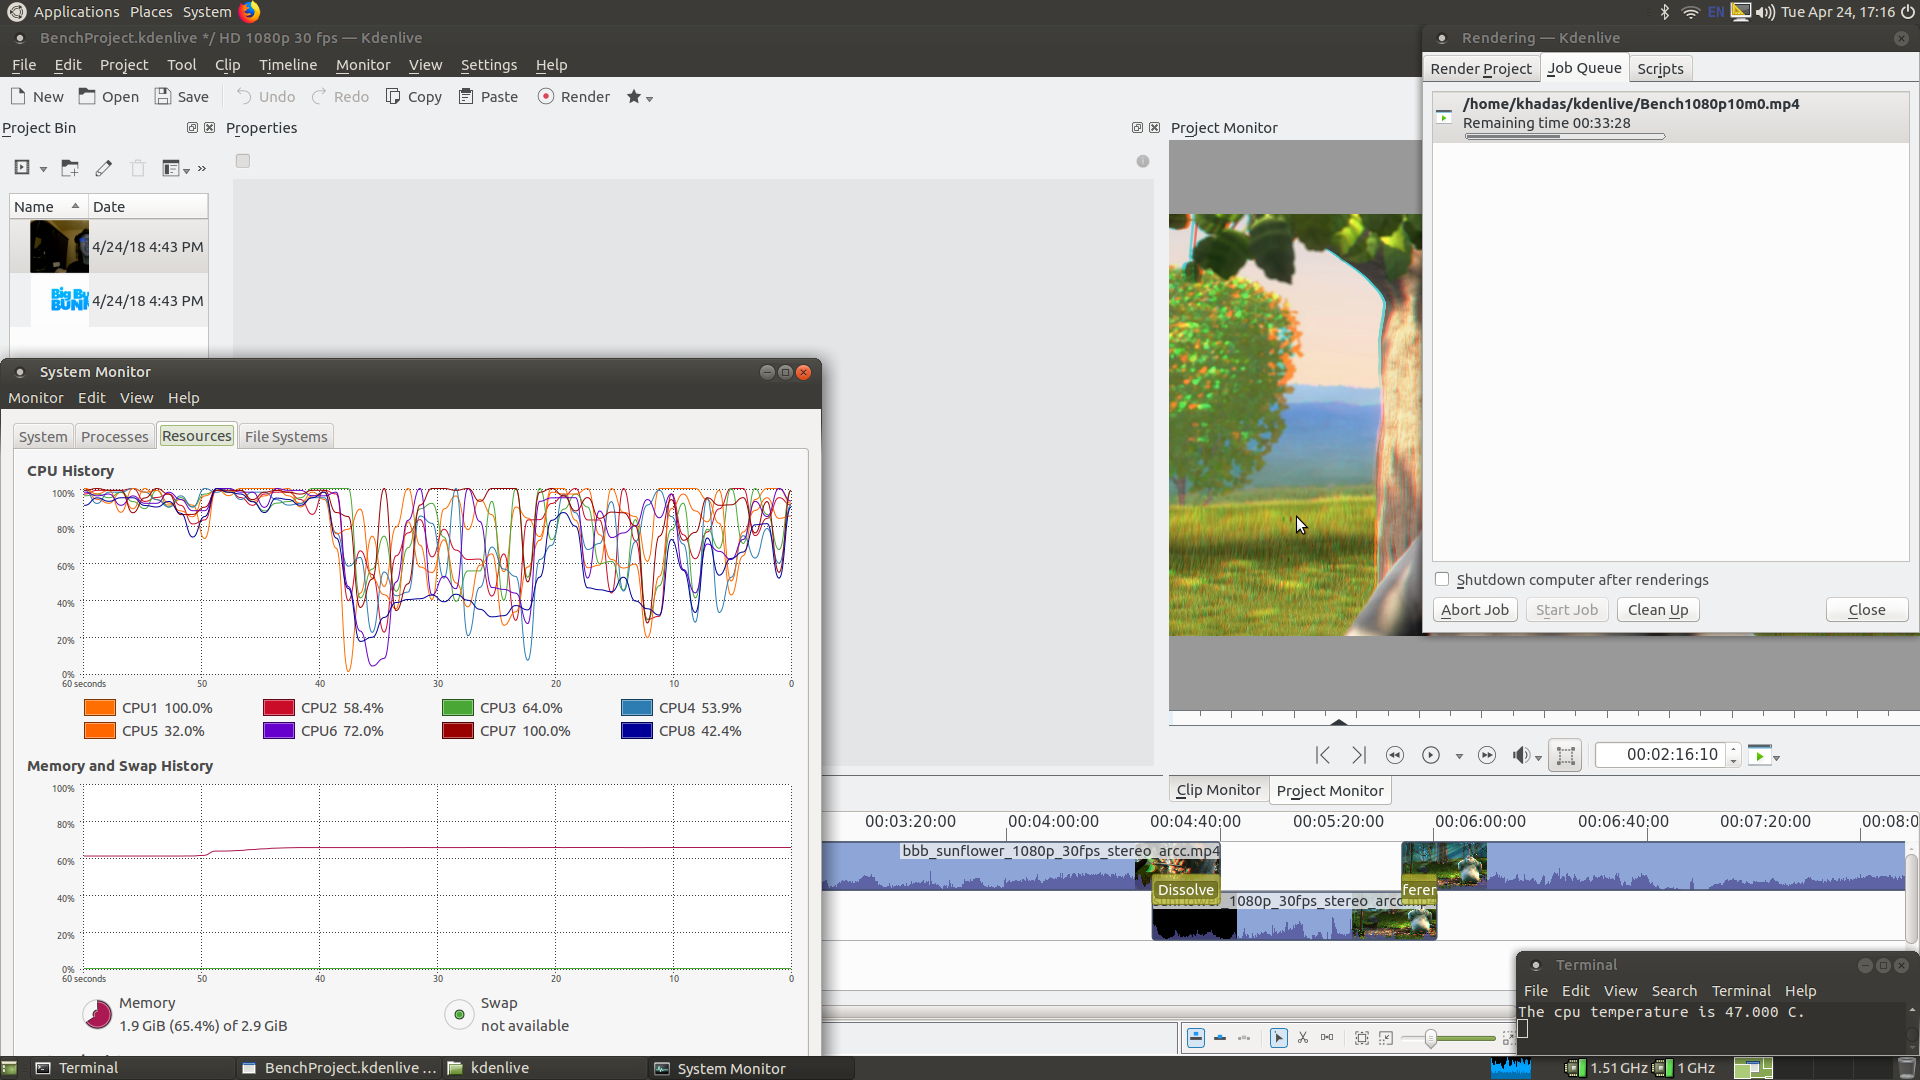
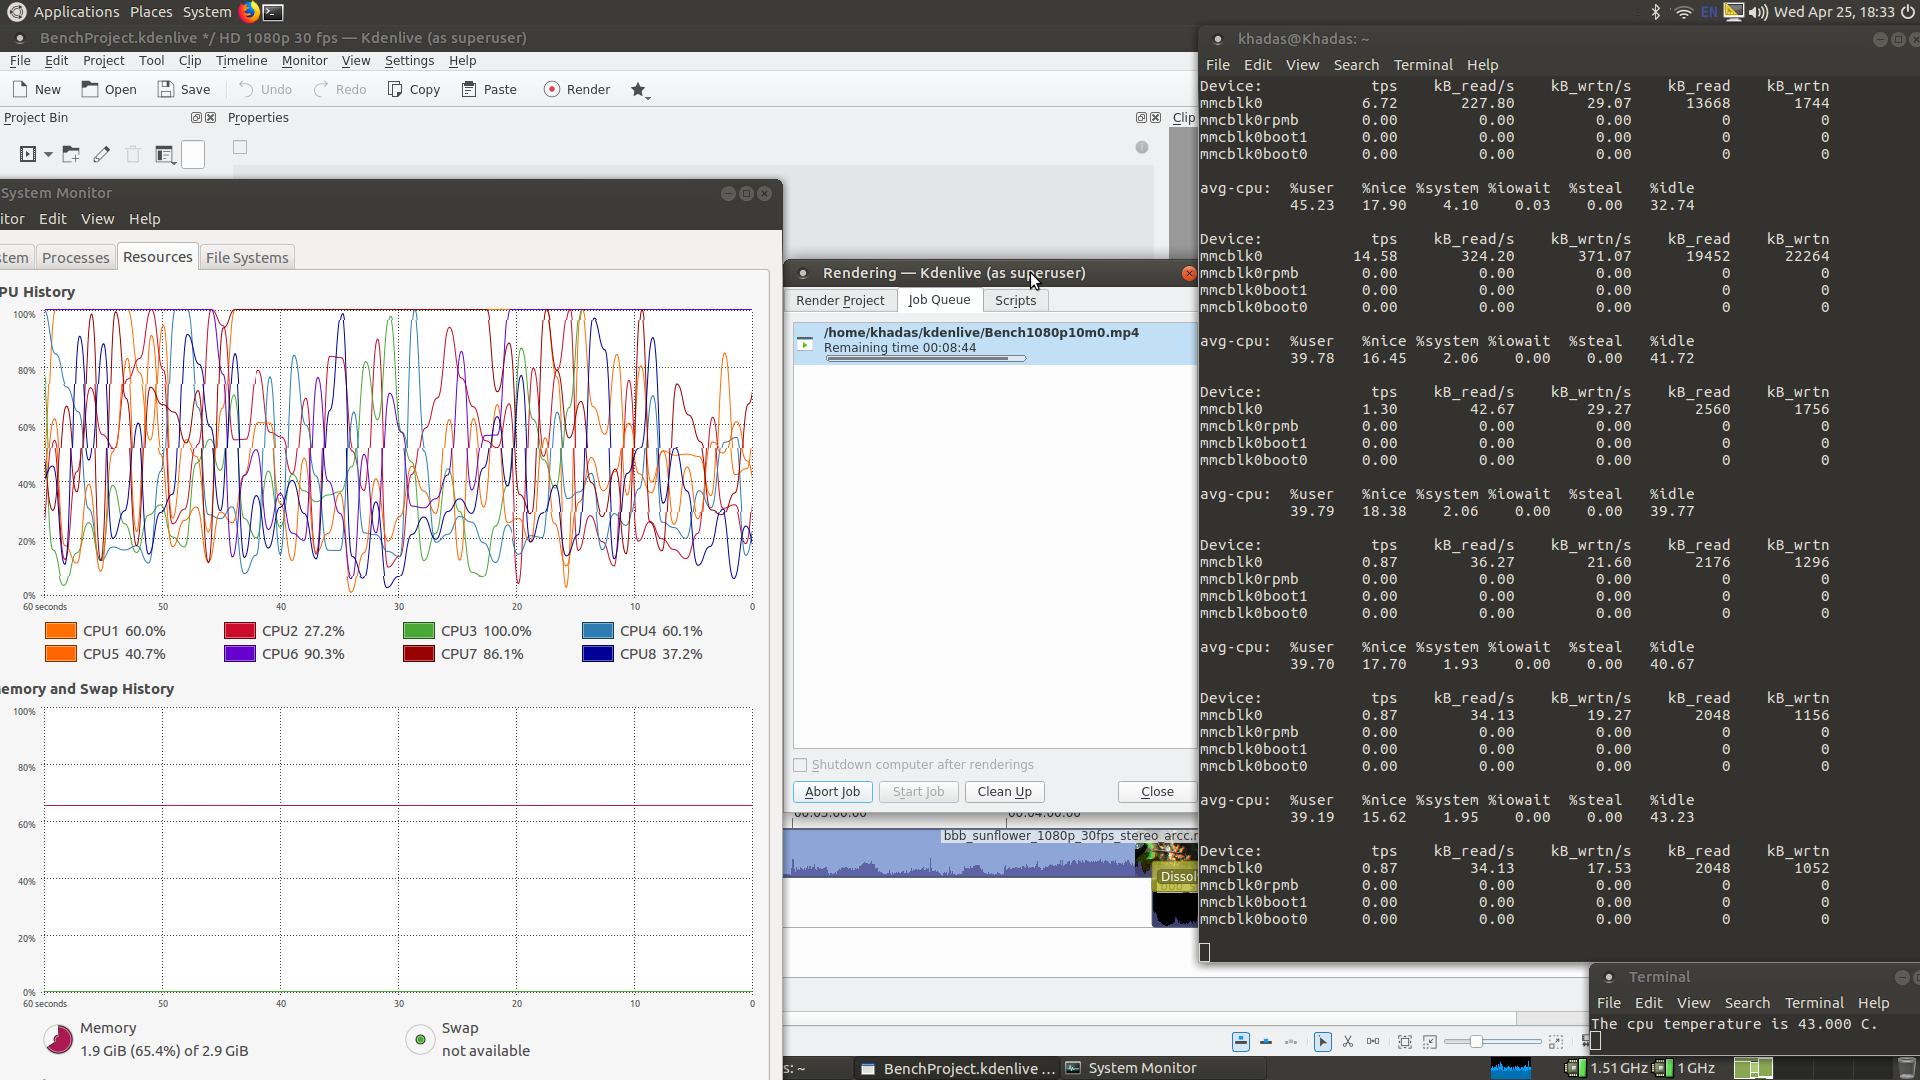
    Here screenshots of kdenlive with iostat running. The first one is where it starts misbehaving, the 2nd is afte a while, so all the numbes are from after it starts doing that. %iowait doesn`t show anything. %nice goes down a lot.


    Here is what kdenlive logs
    khadas@Khadas:~$ sudo kdenlive
    Removing cache at “/home/khadas/.cache/kdenlive-thumbs.kcache”
    QXcbConnection: XCB error: 8 (BadMatch), sequence: 591, resource id: 65011728, major code: 154 (Unknown), minor code: 11
    QIODevice::write (QTemporaryFile, “/tmp/ktar-TJ9748.tar”): device not open
    QCoreApplication::postEvent: Unexpected null receiver
    QFile::setFileName: File (/home/khadas/.local/share/stalefiles/kdenlive/BenchProject.kdenliveZErfile_%2Fhome%2Fkhadas%2Fkdenlive%2FBenchmarkWYUBIZEr) is already opened
    Removing cache at “/home/khadas/.cache/kdenlive-thumbs.kcache”
    // / processing file open
    // / processing file open: validate
    Opening a document with version 0.91 / 0.91
    // / processing file validate ok

FOUND GUIDES: 0


“Creating audio thumbnails (1/1)”
“Creating audio thumbnails (2/1)”
playlistPath: “/tmp/kdenlive_rendering_Lh9748.mlt.mlt”

//STARTING RENDERING: true , false , “/usr/bin/melt” , “atsc_1080p_30” , “avformat” , “-” , “/tmp/kdenlive_rendering_Lh9748.mlt.mlt” , “/home/khadas/kdenlive/Bench1080p10m0.mp4” , () , (“properties=x264-medium”, “vb=4000k”, “ab=160k”, “threads=8”, “real_time=-1”) , -1 , -1
Skipped method “slotGotProgressInfo” : Type not registered with QtDBus in parameter list: MessageType
Skipped method “slotTimelineClipSelected” : Pointers are not supported: ClipItem*
Unsupported return type 65 QPixmap in method “grab”
QLayout: Attempting to add QLayout “” to QWidget “”, which already has a layout
QCoreApplication::postEvent: Unexpected null receiver
khadas@Khadas:~$

I`ll do the same when I get my C2 operational.
Thank you.

Apples & pears :grinning:
The benchmark spec by Götz is plain 7za b. The Pi 3 total output in his table is 2978. I just got 3011 on my RPi3. And 5471 on my VIM2. Logs below.
Raspberry Pi3

7za b

7-Zip (a) [32] 16.02 : Copyright (c) 1999-2016 Igor Pavlov : 2016-05-21
p7zip Version 16.02 (locale=en_GB.UTF-8,Utf16=on,HugeFiles=on,32 bits,4 CPUs LE)

LE
CPU Freq:   701  1198  1198  1198  1198  1199  1197  1198  1198

RAM size:     927 MB,  # CPU hardware threads:   4
RAM usage:    882 MB,  # Benchmark threads:      4

                       Compressing  |                  Decompressing
Dict     Speed Usage    R/U Rating  |      Speed Usage    R/U Rating
         KiB/s     %   MIPS   MIPS  |      KiB/s     %   MIPS   MIPS

22:       1741   307    552   1694  |      56636   393   1228   4832
23:       1773   322    561   1807  |      54284   387   1214   4697
24:       1720   324    571   1850  |      53830   394   1200   4726
25:          0     0   1102      0  |      50346   379   1182   4481
----------------------------------  | ------------------------------
Avr:             238    697   1338  |              388   1206   4684
Tot:             313    951   3011

VIM2

7za b

7-Zip (a) [64] 16.02 : Copyright (c) 1999-2016 Igor Pavlov : 2016-05-21
p7zip Version 16.02 (locale=en_GB.UTF-8,Utf16=on,HugeFiles=on,64 bits,8 CPUs LE)

LE
CPU Freq:  1000  1002  1001  1002  1001  1001  1412  1416  1415

RAM size:    2998 MB,  # CPU hardware threads:   8
RAM usage:   1765 MB,  # Benchmark threads:      8

                       Compressing  |                  Decompressing
Dict     Speed Usage    R/U Rating  |      Speed Usage    R/U Rating
         KiB/s     %   MIPS   MIPS  |      KiB/s     %   MIPS   MIPS

22:       3358   556    587   3267  |      89500   673   1134   7634
23:       3320   577    586   3383  |      87961   677   1125   7612
24:       3247   600    582   3492  |      85329   672   1114   7489
25:       3327   646    588   3799  |      79665   657   1079   7090
----------------------------------  | ------------------------------
Avr:             595    586   3485  |              670   1113   7456
Tot:             632    850   5471

The crappy slow S912 cores do help with overall extra throughput even though they are useless in general and a minefield for any normal scheduling!

Even limiting the VIM2 to the faster cores it outperforms a RPi3:

$ taskset -c 0-3 7za b

7-Zip (a) [64] 16.02 : Copyright (c) 1999-2016 Igor Pavlov : 2016-05-21
p7zip Version 16.02 (locale=en_GB.UTF-8,Utf16=on,HugeFiles=on,64 bits,8 CPUs LE)

LE
CPU Freq:  1408  1412  1412  1413  1412  1413  1413  1412  1413

RAM size:    2998 MB,  # CPU hardware threads:   8
RAM usage:   1765 MB,  # Benchmark threads:      8

                       Compressing  |                  Decompressing
Dict     Speed Usage    R/U Rating  |      Speed Usage    R/U Rating
         KiB/s     %   MIPS   MIPS  |      KiB/s     %   MIPS   MIPS

22:       2606   386    657   2536  |      61210   399   1310   5221
23:       2543   394    657   2591  |      59495   397   1298   5149
24:       2423   396    658   2606  |      58195   398   1284   5108
25:       2315   398    665   2644  |      54980   394   1242   4893
----------------------------------  | ------------------------------
Avr:             394    659   2594  |              397   1283   5093
Tot:             395    971   3843

That’s all we need to know (or at least @balbes150). Thank you.

The problem is not armhf vs. arm64 or software not being optimized for the platform but the proprietary crap contained in the bl30.bin BLOB doing weird things. See also Amlogic still cheating with clockspeeds - Page 2 - Amlogic meson - Armbian Community Forums

You were running with 8 threads and not just 4 (that’s the purpose of specifying -mmt4). And your Ubuntu 17.10 contains a newer 7-zip version (16.02) than the one the older numbers were generated with. Interestingly this new 7-zip version also tries to report ‘CPU Freq:’.

Would be interesting what taskset -c 0-3 7za b -mmt4 produces…

$ taskset -c 0-3 7za b -mmt4

7-Zip (a) [64] 16.02 : Copyright (c) 1999-2016 Igor Pavlov : 2016-05-21
p7zip Version 16.02 (locale=en_GB.UTF-8,Utf16=on,HugeFiles=on,64 bits,8 CPUs LE)

LE
CPU Freq:  1402  1406  1410  1409  1411  1410  1410  1410  1410

RAM size:    2998 MB,  # CPU hardware threads:   8
RAM usage:    882 MB,  # Benchmark threads:      4

                       Compressing  |                  Decompressing
Dict     Speed Usage    R/U Rating  |      Speed Usage    R/U Rating
         KiB/s     %   MIPS   MIPS  |      KiB/s     %   MIPS   MIPS

22:       2192   316    676   2133  |      61181   397   1314   5220
23:       2179   327    679   2221  |      60056   398   1305   5196
24:       2181   344    683   2346  |      58525   398   1291   5138
25:       2163   357    692   2470  |      54240   386   1251   4827
----------------------------------  | ------------------------------
Avr:             336    682   2292  |              395   1290   5095
Tot:             365    986   3694

It is an interesting comparison tool in that Götz has a large range of numbers in the table. But I feel RAM size has an effect (because watching gkrellm on my VIM2 when it was running it seemed to use approaching 2G) and that is plain not possible on the Pi. Equally the Pi runs 32bit, the VIM2 may (just may) benefit from the extra aarch64 registers. etc etc

This number indicates S912 fast cluster running at ~1420 MHz compared to RPi 3 result (running at 1200 MHz). But why did @numbqq’s and @NicoD’s results differ that much? Well, they’re using Xenial and there the 7-zip packaged version is a rather old/outdated one…

Nico - Thomas is certainly more familiar with iostat than I am, but to me while the IO load does increase a bit it doesn’t look to me high at all. Nevertheless you land with 8 cores doing the work of 3 or on tea-break or whatever.

A question, where is your Ubuntu installed? SDcard or eMMC? df -h should give it away. (as well as if you have any odd mounts in your home directory.)
And second question, are the latest runs above (with iostat) with the performance governor?

Apologies for hijacking your thread with the VIM2/S912 issues!

I am delighted to note that this time I got the numbers right - numbqq is running a version of 7z from 2010! At least my version is the same on my Pi and my VIM! It seems incredible the 7z version changes 16.04 to 17.10 but NicoD has the same as numbqq so I guess that explains that.

1 Like

Yep, nothing IO bound (and he’s running off eMMC, see the two boot partitions). So no clues why kdenlive slows down. This is also an example where weird cpufreq behaviour can not be blamed since in such situations the application should still show 100% CPU utilization on all cores even if the ‘firmware’ on the Cortex-M3 inside the SoC does what it wants…

The cpufreq governor is irrelevant in this situation. There are 2 or with Amlogic 3 layers:

  • Application behaviour: the app should utilize CPU ressources as needed. In the above example we see just some %usr and some %nice percentage but far away from full CPU load. What we want/need to see is close to 100% CPU utilization with such an application.
  • cpufreq scaling driver will only react to CPU utilization. Can be a bottleneck but the root cause for bad performance here is the app not utilizing the CPUs for whatever reasons
  • And then as an additional layer with Amlogic we have the proprietary stuff running on the Cortex-M3 inside the SoC doing whatever it wants and faking clockspeeds (ignoring cpufreq requests and returning bogus values)

But the problem is app behaviour. And since there is no IO and no memory bottleneck (at least no obvious) this would need further investigation. And indeed df -h output would be interesting to see where /tmp lives.